1 · Start and mark
Tap Rest start, Training start, Recovery start as your protocol progresses – one tap marks every running recording.
 CARLON HRV Research
Up to four Polar H10 or Movesense Flash sensors record to their own memory – the iPhone can stay behind. One tap on the iPhone marks each phase. You get original RR data, per-phase metrics, publication figures and a draft methods paragraph.

| Platform | iPhone with iOS 17 or later |
|---|---|
| Sensors | Polar H10 and Movesense Flash – up to four at once from one iPhone |
| Onboard recording | Polar H10: up to 95,000 RR intervals (about 20 h of everyday life, about 10.5 h at 150 bpm) · Movesense Flash: about 11 h of ECG at 256 Hz plus motion |
| RR data | Polar H10: resolution 1/1024 s live, 1 ms from its memory · Movesense Flash: R peaks detected in the 256 Hz ECG · exported as recorded |
| Protocol phases | Event buttons, one tap marks every running recording; segment and event tables in the export |
| Metrics | RMSSD, SDNN, pNN50, SD1/SD2, LF/HF, Baevsky, DFA α1; α1 also over time in 2-minute windows every 5 s |
| Exports | CSV with Kubios import settings, Kubios text, FIT, EDF+, WFDB, JSON (complete export with audit trail), PDF report, figures as vector PDF and 300-dpi PNG |
| Validation | 331 of 331 checks passed against NeuroKit2, SciPy and Task Force definitions (validation dossier 1.4) |
| Privacy | No account, no CARLON server, no usage analytics in the app |
| Version | 1.4 · page updated November 2, 2026 |
Watch heart rate and HRV live while you work with a client or participant – or let Polar H10 and Movesense Flash record into their own memory while the iPhone stays behind. With Polar H10, both at once: if Bluetooth drops, the strap keeps recording.
Heart rate and HRV on screen as it happens – show your client their body’s response in real time. First values after 20 seconds.
Start, and the iPhone doesn’t need to be there: overnight, on the track, a whole field day. Stop and read out afterwards.
With Polar H10 the live view runs alongside the strap recording. If Bluetooth drops, the live view pauses – the strap keeps recording.
Up to 95,000 RR intervals in the sensor’s own memory – about 20 h of everyday life, about 10.5 h at 150 bpm. One recording per strap.
Raw ECG at 256 Hz plus 9-axis motion – the most data-rich mode, all in the sensor. The app derives RR from the ECG when reading out.
Each recording is matched to its participant code with its stored start time – no manual file matching.
Capacities: Polar H10 stores up to 95,000 RR intervals offline – about 20 h of everyday life (Krummenacher et al. 2025), about 10.5 h at 150 bpm; Polar’s 30 h refer to heart rate once per second. Movesense Flash: 128 MB; measured 2.9 kB/s with the app’s ECG 256 Hz + 9-axis motion 52 Hz – about 11 h, as the logger slows near 125 MB (Movesense); the manufacturer’s 60 h refer to ECG alone.
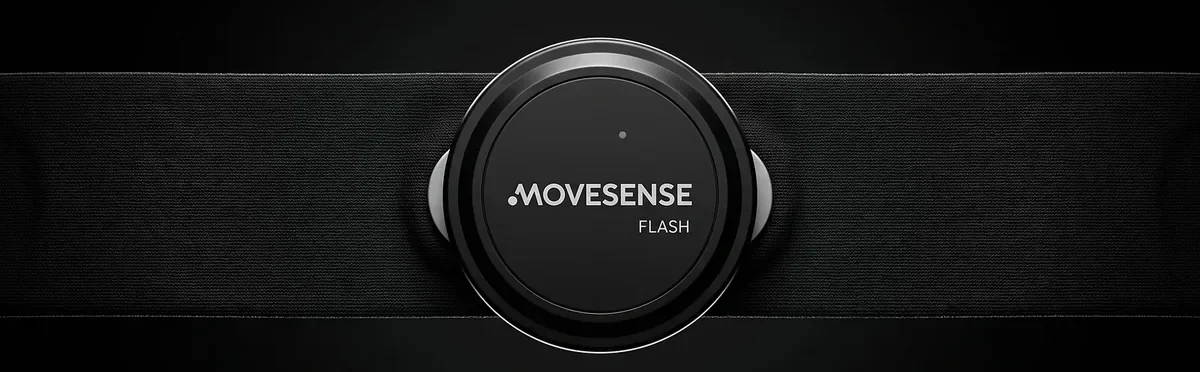
Both capture the heart's electrical signal at the chest – unlike optical wrist and ring sensors, which measure the pulse wave. The app is tested with both, and they can run side by side in one study.
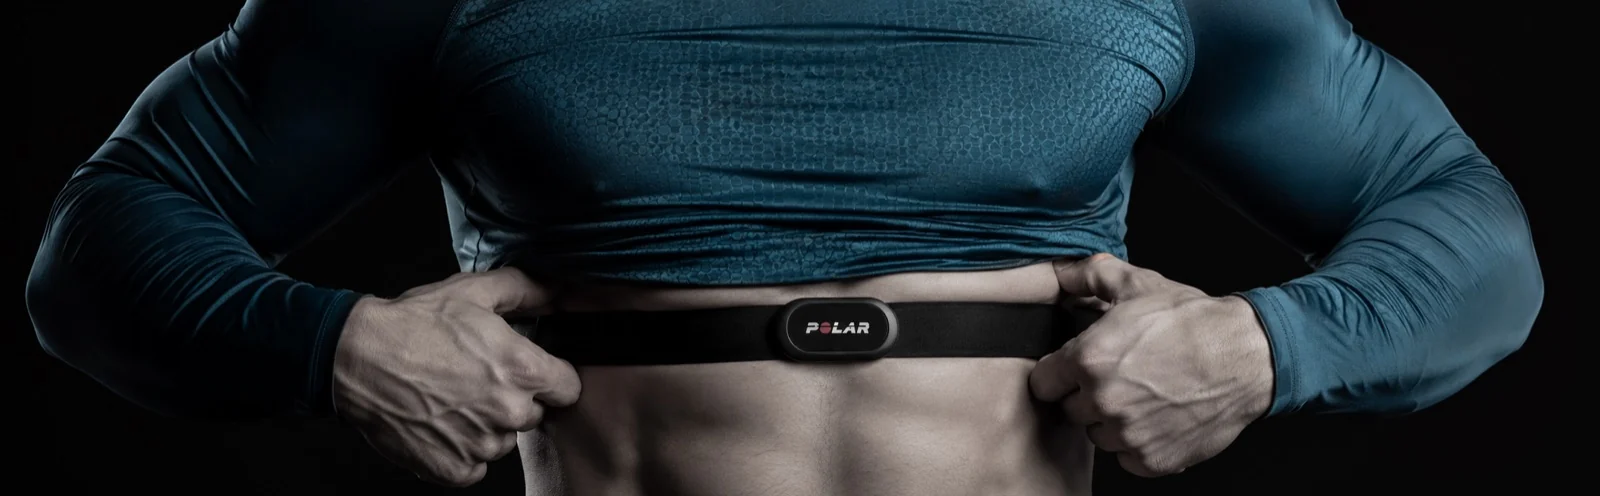
Polar H10 validity against ECG: Gilgen-Ammann et al. 2019; Schaffarczyk et al. 2022.
Recording is only part of the work. Assigning files, marking phases, preparing data and documenting – this is what the app takes off your hands.
All sensors read out in one go, each to its participantinstead of: one phone or strap app per participant
Every recording is matched to its participant code, with its stored start timeinstead of: files copied out, renamed, matched to people by hand
Phases marked with one tap, each with its clock timeinstead of: start times and phase changes noted on paper and retyped
A segment table with values per phase, prepared for Kubios or Rinstead of: each phase cut out in a spreadsheet before analysis
A draft methods paragraph, citation and figures in single- and double-column widthsinstead of: methods text and figures written and drawn from scratch
Tap Rest start, Training start, Recovery start as your protocol progresses – one tap marks every running recording.
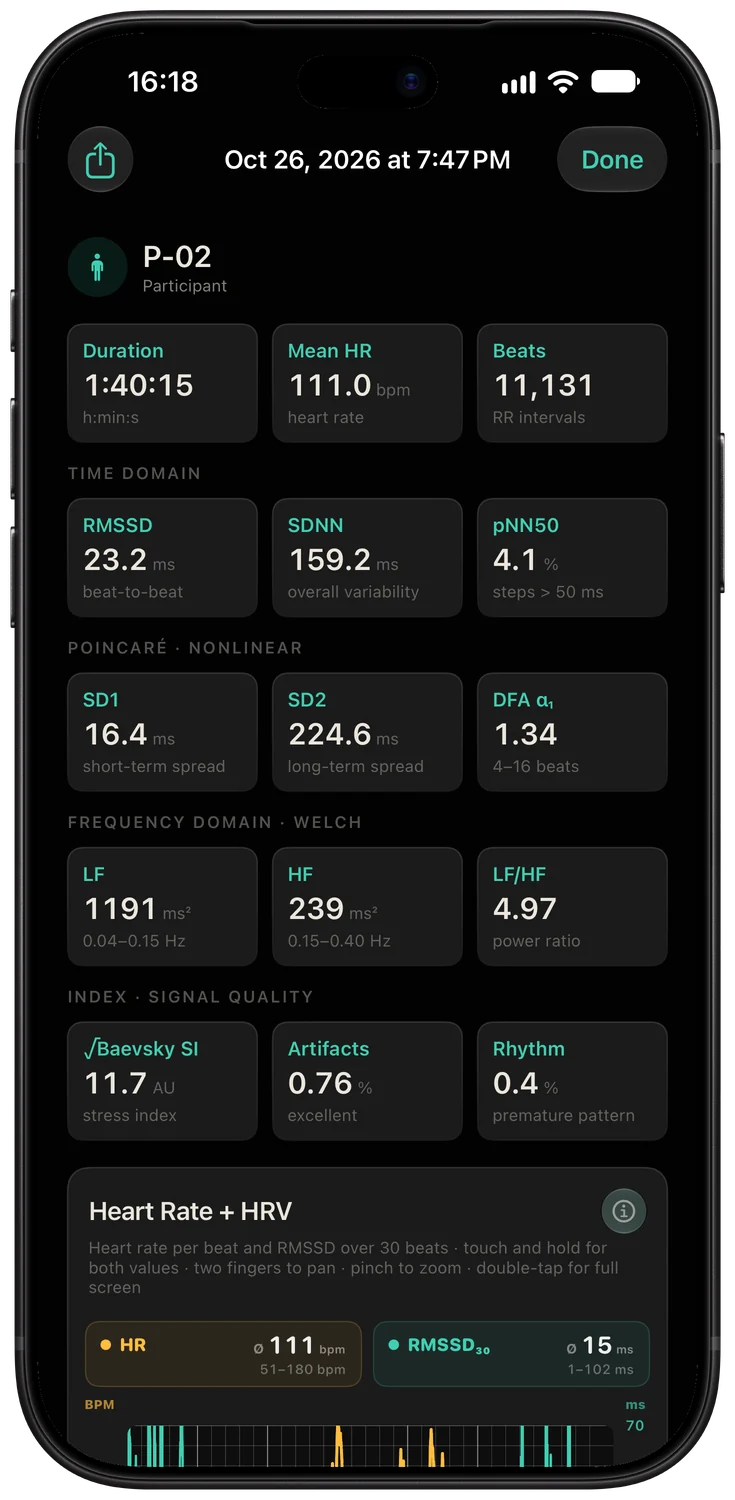
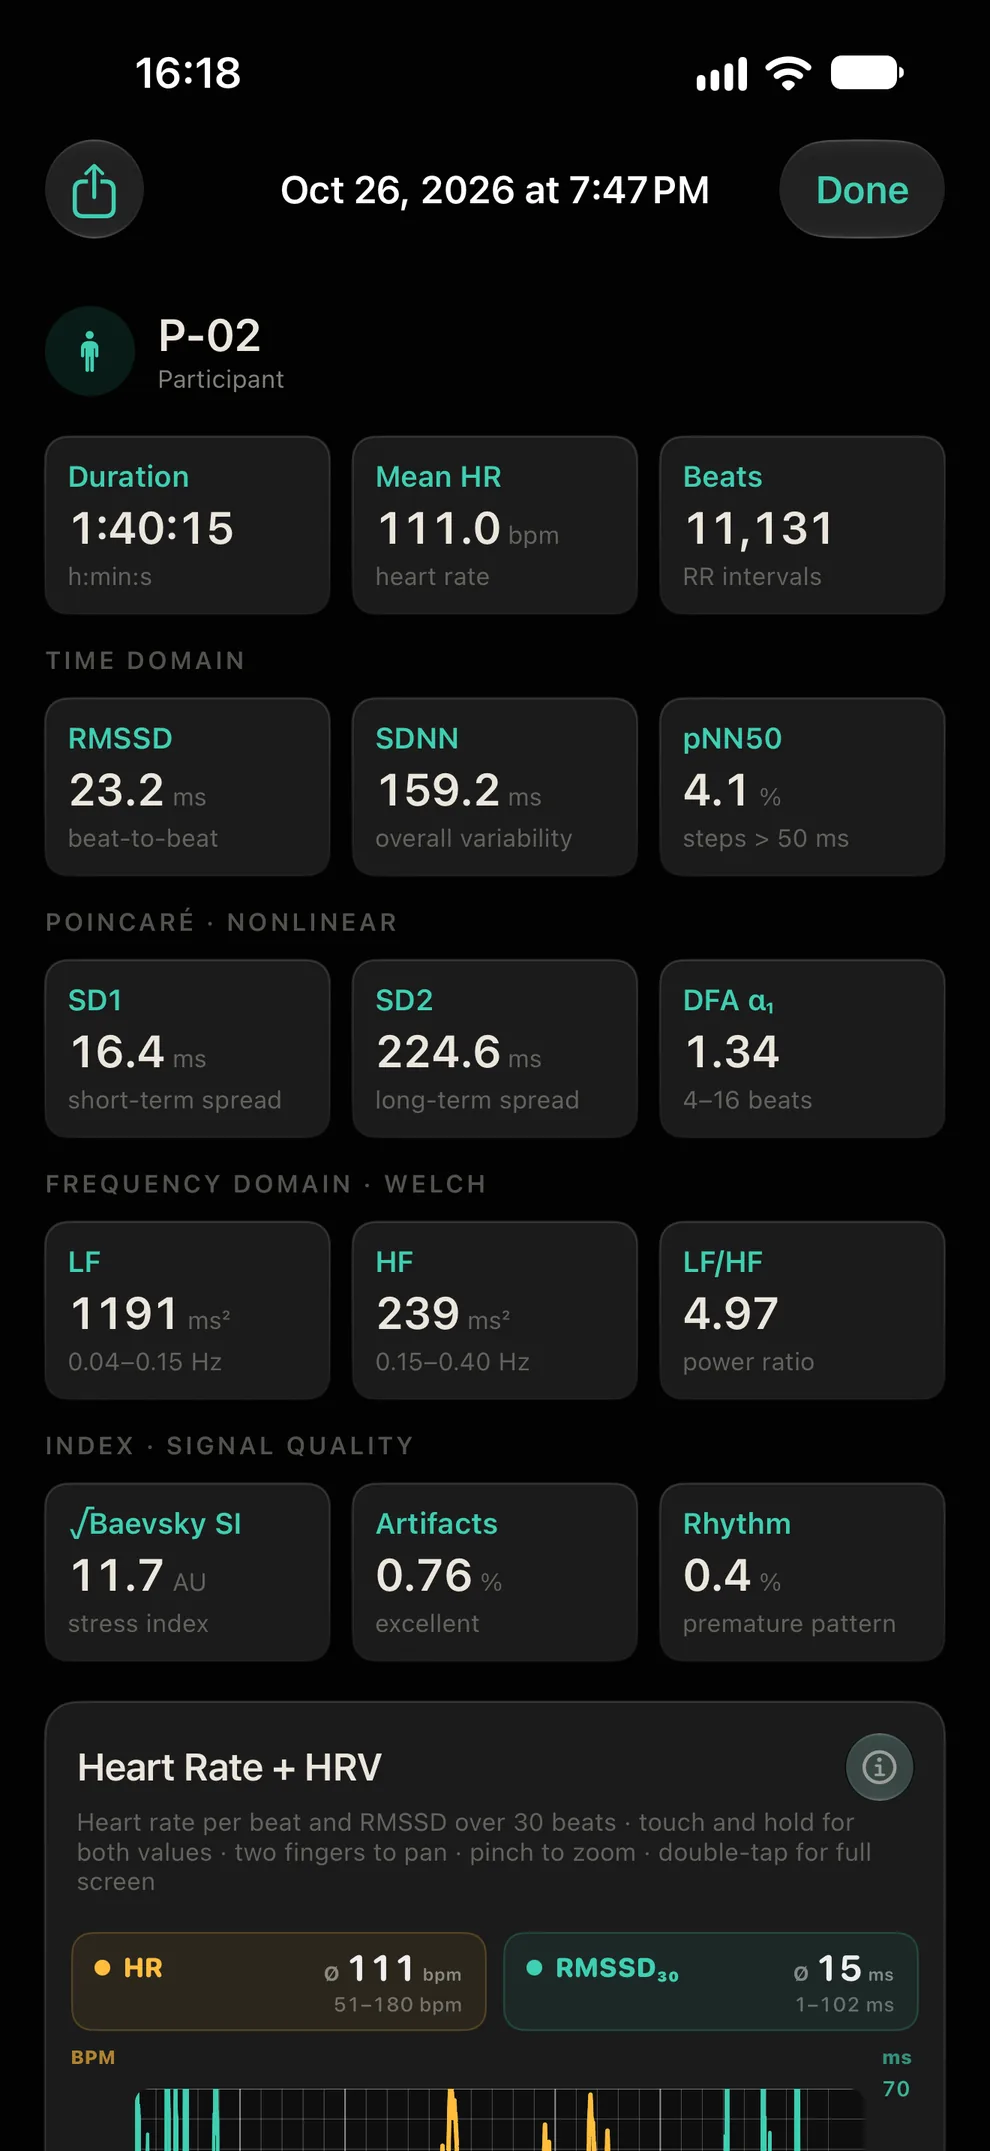
After read-out, each recording opens with its participant code, stored start time and every metric at a glance – time domain, Poincaré, DFA α1, frequency domain and signal quality.
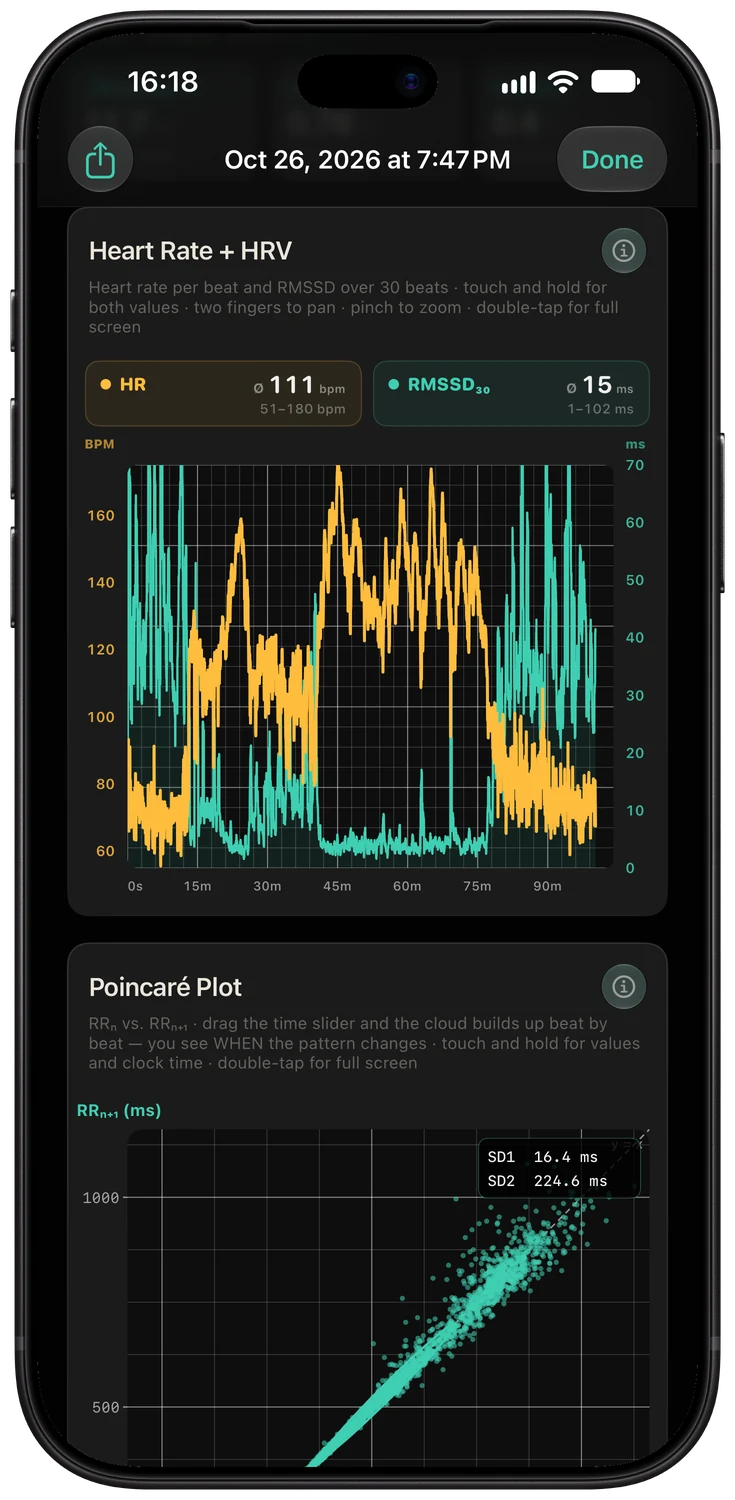
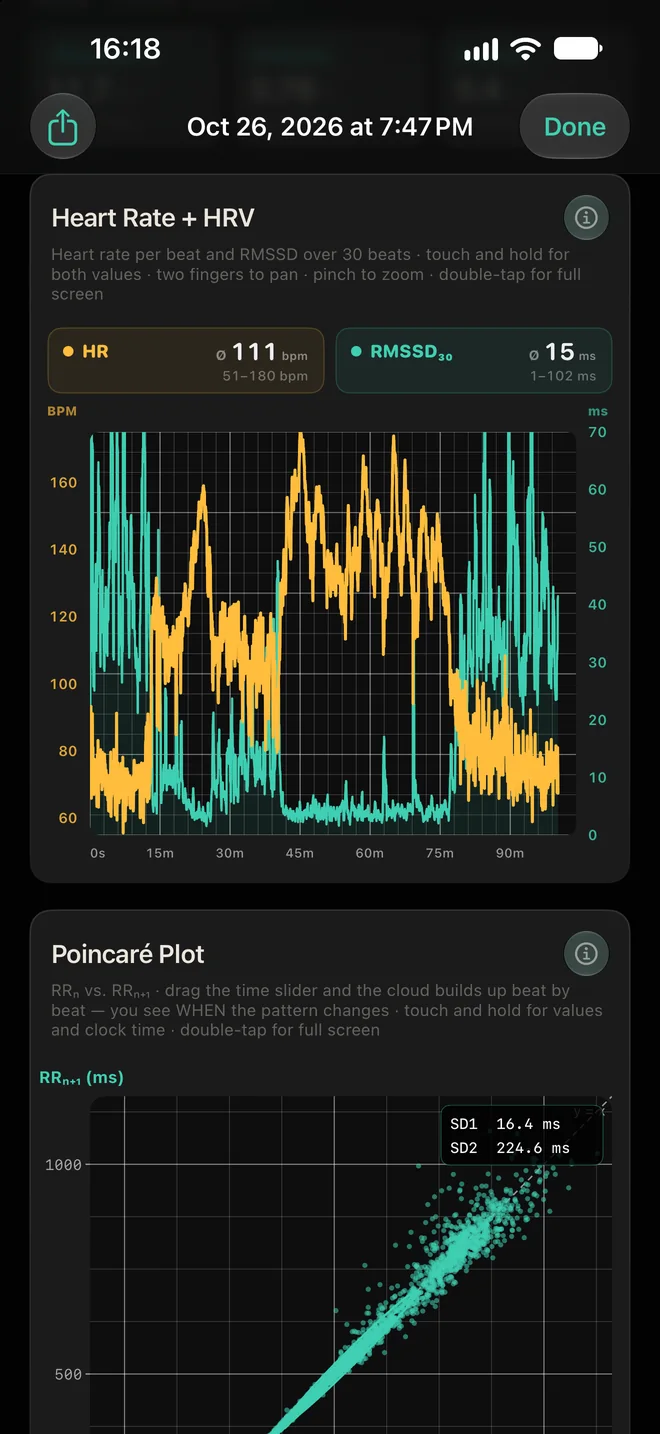
Heart rate and HRV together over the whole session – touch and hold for values.
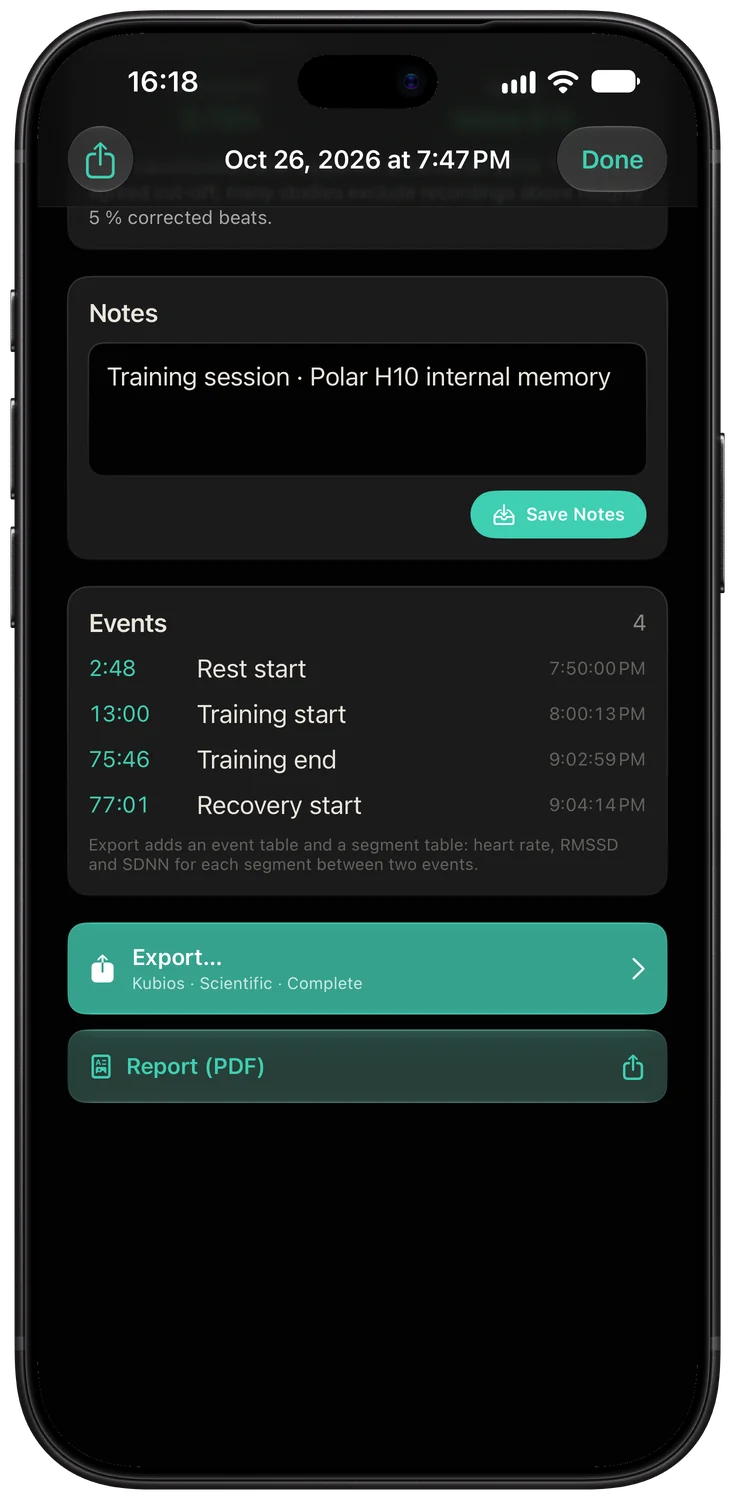
Every event with its clock time – and a segment table with values per phase in the export.
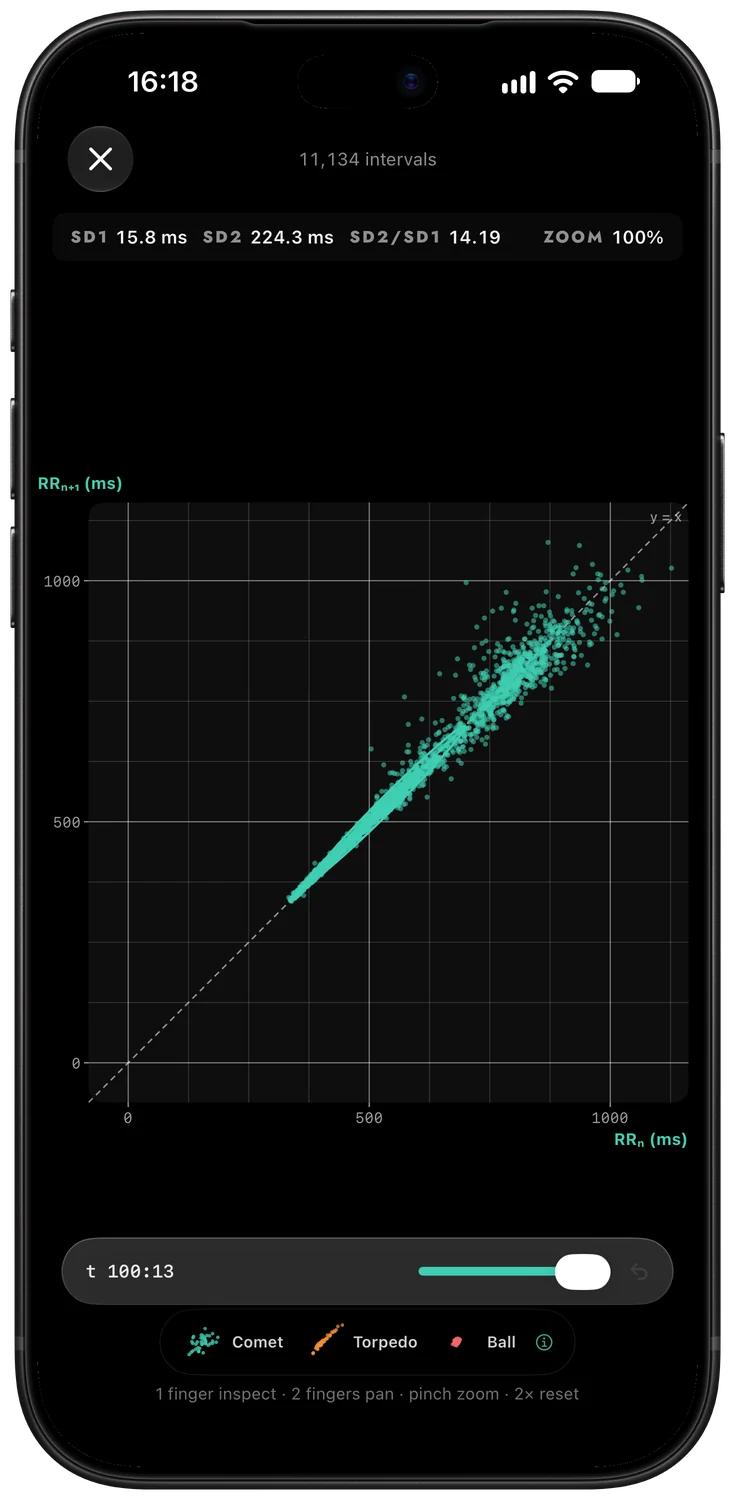
Every chart full screen, portrait or landscape: Poincaré, tachogram, spectrum, DFA α1 over time – each with method and source.
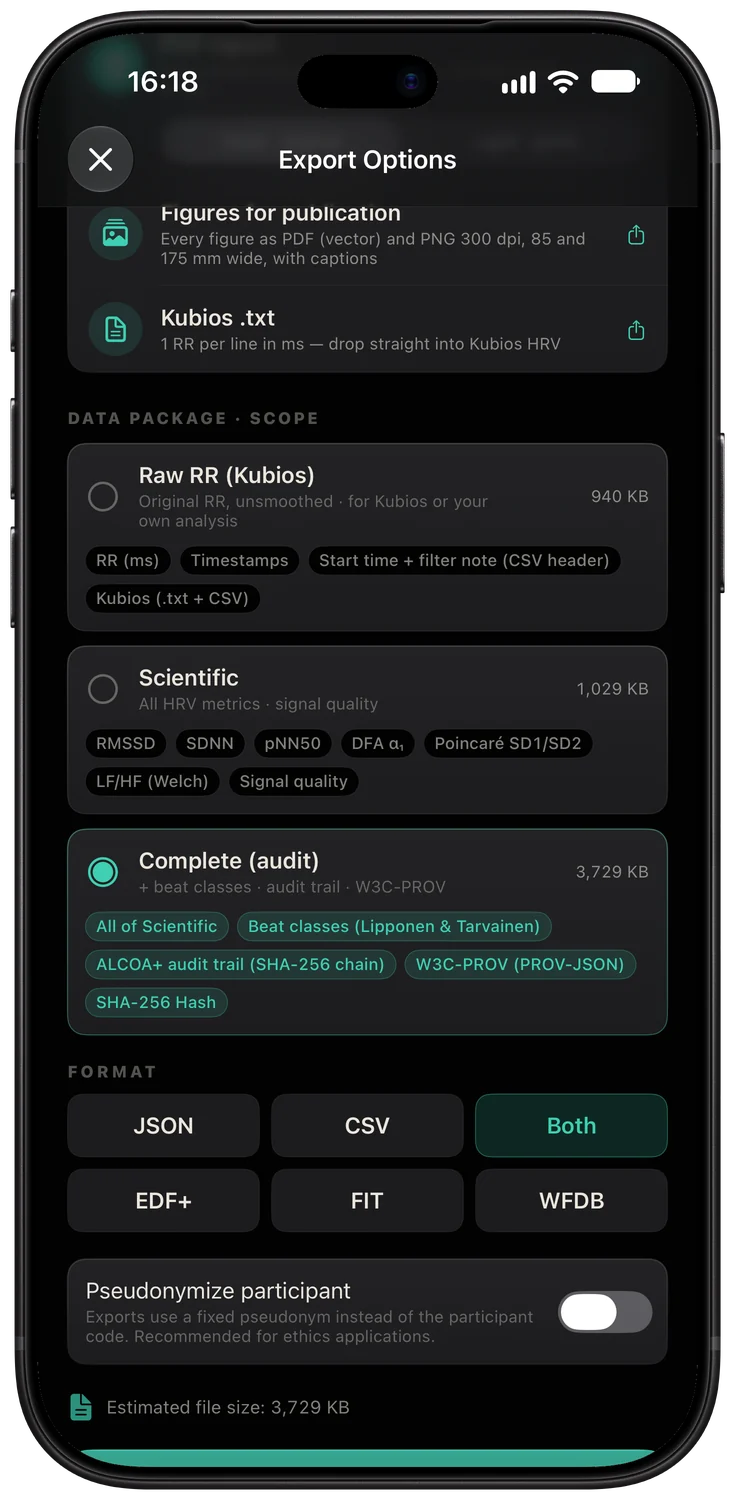
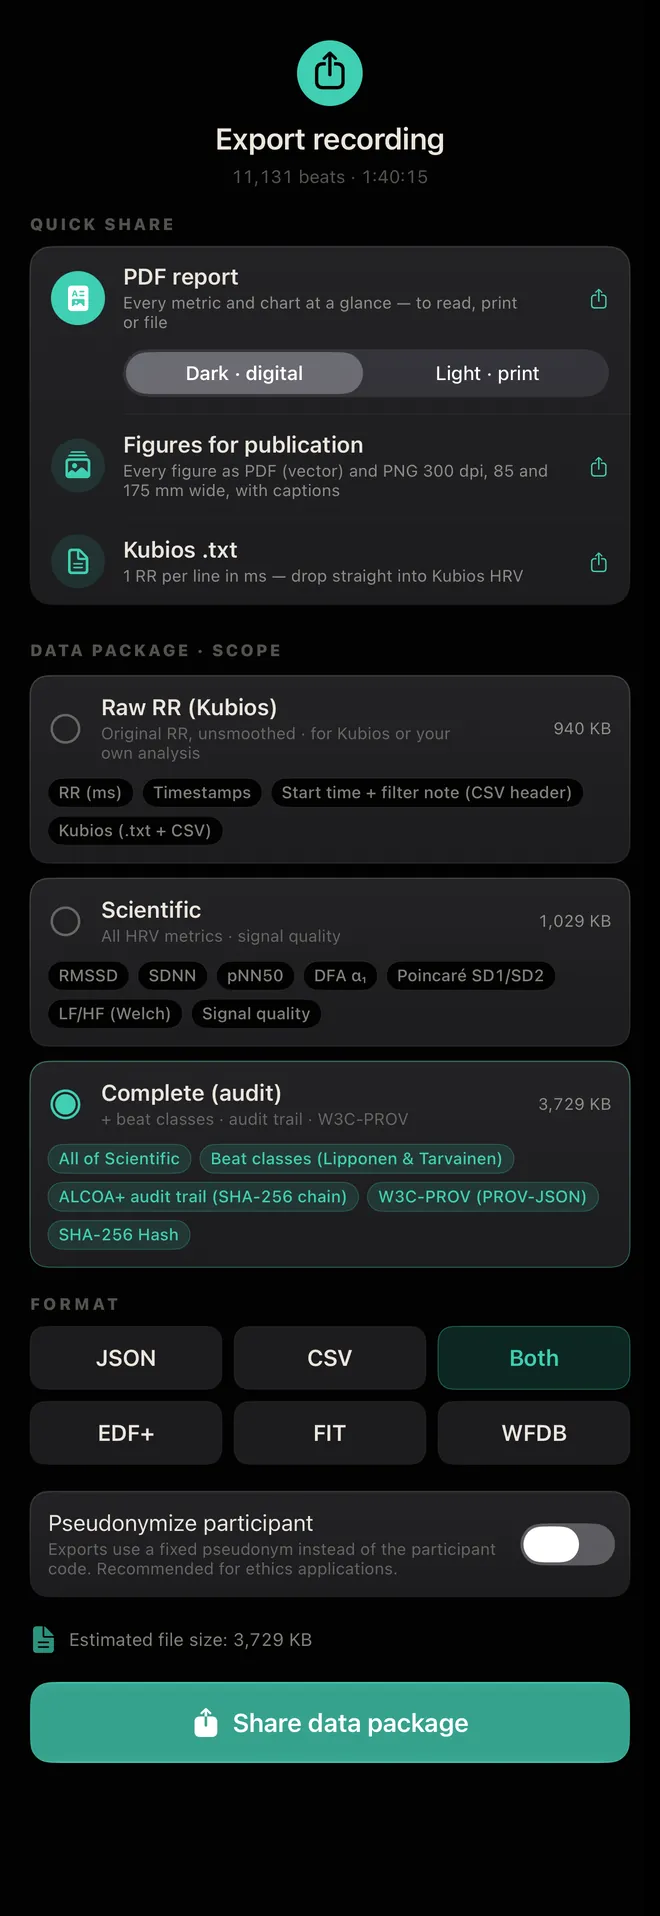
PDF report, figures for publication, Kubios, and data packages as JSON, CSV, EDF+, FIT or WFDB – shared from the iPhone.
Screens from the app with real recordings. The app interface is in English.
RR data for your own analysis tools – plus reports, figures and documentation.
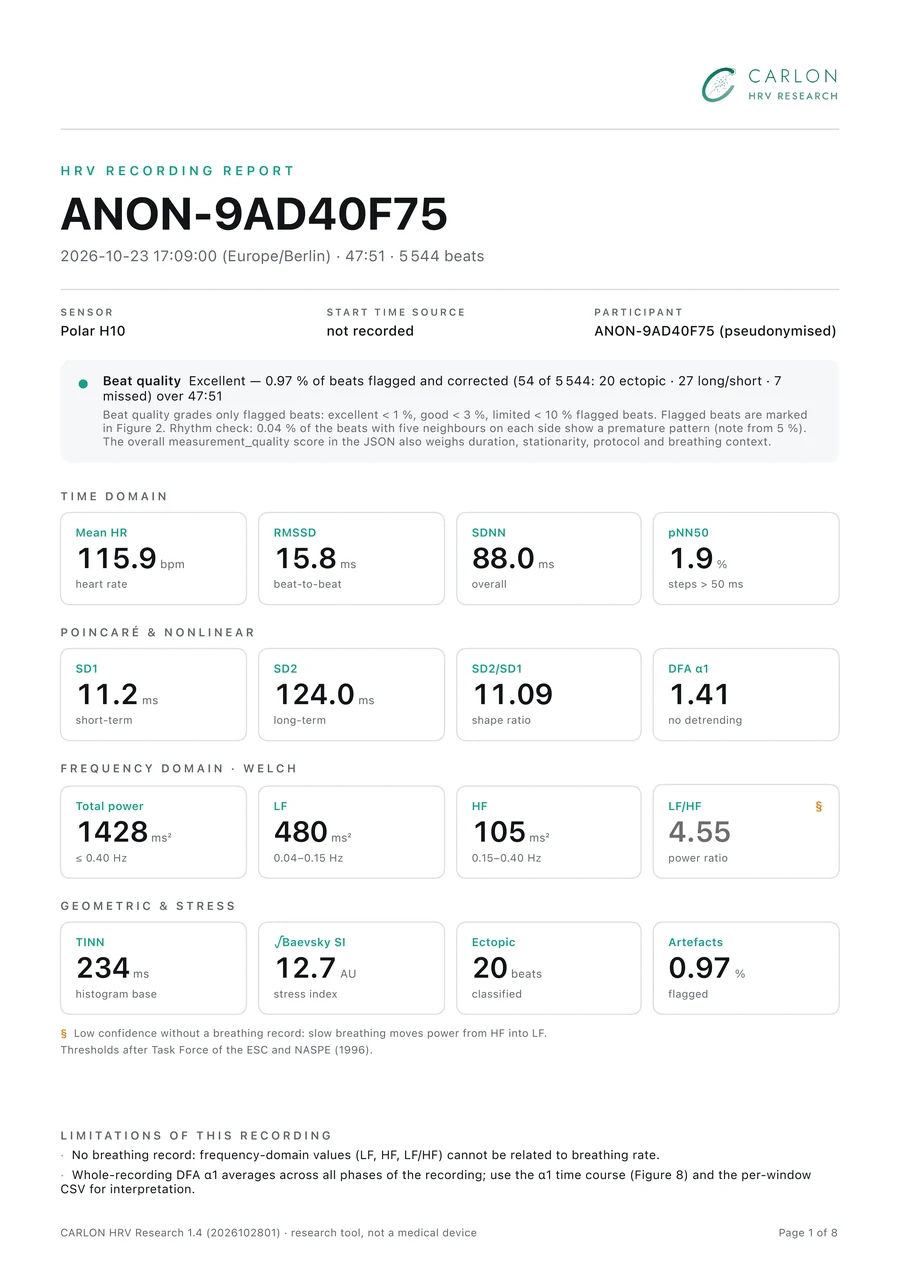
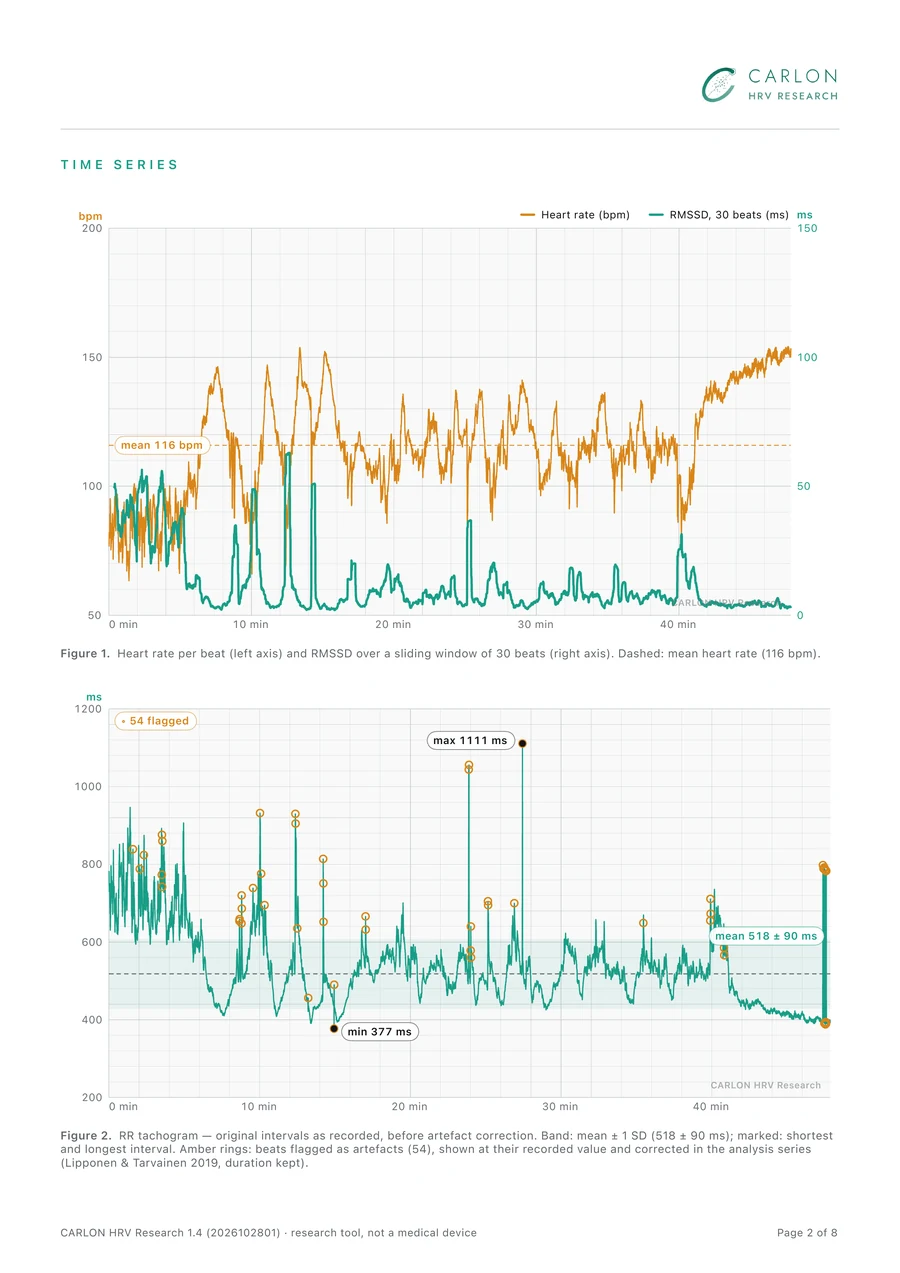
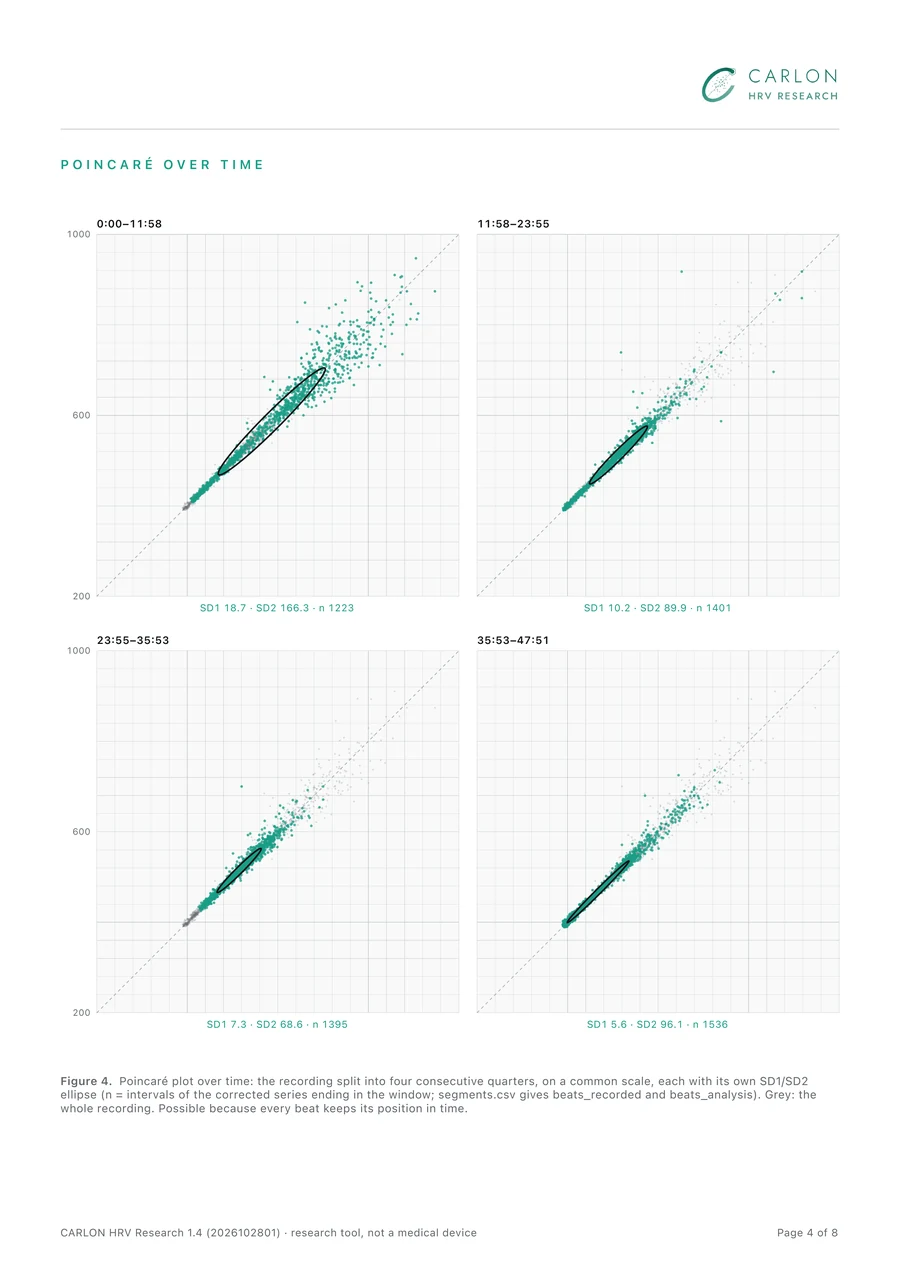
Report, figures and data are all from one real 48-minute training session up to 155 bpm with a Polar H10, exported by the same build: every export format, the PDF report and the figures – open it in Kubios, Python or R and check every value yourself. CC BY 4.0.
Every report ends with this paragraph – every parameter, every reference, the exact app build. Here is the one for the example recording; yours carries your own values. Review and adapt it to your protocol.
RR intervals were recorded with a Polar H10 (recording path not stored with this recording; RR resolution in the data: 1 ms) and processed with CARLON HRV Research, version 1.4, build 2026102801 (Rohwedder, 2026). The recording comprises 5544 RR intervals over 2871.2 s (sum of intervals), starting 2026-10-23 17:09:00 Europe/Berlin (UTC+02:00; start time source not recorded). Beats were classified with the algorithm of Lipponen and Tarvainen (2019) (α = 5.2, 91-beat windows, c₁ = 0.13, c₂ = 0.17; implementation verified beat for beat against NeuroKit2 signal_fixpeaks), with both thresholds bounded below at 30 ms so that beat-to-beat changes smaller than 30 ms, typical of exercise, are not classified as artefacts (see the app's validation report). 0.97 % of beats were flagged. Each run of consecutive flagged intervals was replaced by equal intervals of the same total duration, their number given by whole multiples of the local rhythm where every interval of the run is one (missed beats), otherwise by the classification (one fewer per extra beat, otherwise the same, so a premature beat and its compensatory pause are averaged); normal beats were left unchanged and the duration of the recording was preserved, except for single flagged intervals without compensation, which were replaced by the mean of their neighbours. The per-beat classification and correction are included in the complete export. Mean heart rate was computed as 60 000 / mean RR over all original intervals; SDNN, RMSSD, pNN50 and the Poincaré descriptors SD1 and SD2 (Brennan et al., 2001) were computed on the corrected series. Spectral power was estimated over the whole corrected series with Welch's method (symmetric Hann window of 256 samples = 64 s, 50 % overlap, segment mean removed, density scaling) after natural cubic-spline resampling at 4 Hz; band powers were integrated exactly at the band limits (LF 0.04–0.15 Hz, HF 0.15–0.40 Hz; Task Force, 1996). Baevsky's stress index is reported as √SI with SI = AMo / (2 · Mo · MxDMn) (Baevsky, 1984): histogram of the corrected series with 50-ms bins on the absolute grid (…, 600–650, 650–700 ms …; Baevsky and Kubios convention); Mo = centre of the tallest bin (s), AMo = its share of beats (%), MxDMn = range of the series (s); from 10 min of recording the median over consecutive 5-min windows. Short-term fractal scaling (DFA α1) was computed over windows of 4–16 beats on the whole recording without prior detrending (Peng et al., 1995). Time-varying DFA α1 (Figure 8) followed Rogers et al. (2026): 120-s windows recomputed every 5 s on the corrected series after smoothness-priors detrending (Tarvainen et al., 2002; λ = 500, the Kubios default, as the review does not specify λ); windows with 5 % or more corrected beats were omitted, between the 3 % level with small bias and the 6 % level with proportional bias in Rogers et al. (2021) and in line with the exclusion criterion of Schaffarczyk et al. (2022). Segments (Figure 7) and the 60-s epochs of the data export use fixed time grids; a beat belongs to the window in which its interval ends. The RMSSD trace in Figure 1 uses a sliding window of 30 beats as a display aid only. The app's computations were validated against NeuroKit2 (331 of 331 checks passed; CARLON HRV Research validation report). Original RR intervals were retained unaltered for export.
Copy it into the data protection section of your application, adapt it to your study and have it reviewed by your institution. It describes only what the app does.
Recording and storage. RR intervals are recorded with CARLON HRV Research (iOS app) from Polar H10 or Movesense Flash chest sensors via Bluetooth, live or in the sensor’s internal memory with later read-out; until read-out, such a recording remains on the sensor. The app processes and stores the data on the study iPhone. The app has no user account, no server of its own and no usage analytics or advertising services. Data leave the device only through an explicit export by the study team (iOS share sheet) to a destination the team chooses, or through the optional study folder: a folder the team selects in the Files app, e.g. institutional storage, to which the app copies each new recording. Recordings are part of the device’s regular iPhone backup.
Pseudonymization. Participants are entered under a study code chosen by the team (e.g. P-01). On export, the participant can be replaced by a stable pseudonym (ANON- followed by eight hexadecimal characters, derived from an internal identifier with SHA-256). The key linking code and person is kept by the study team outside the app. The data are therefore pseudonymized, not anonymized. Free-text notes are exported as entered; the study team decides what they contain.
Integrity and deletion. Original RR intervals are stored as recorded (physiologically impossible values are discarded and counted); corrections are kept separately. Changes are logged in an append-only audit trail following ALCOA+ principles; a SHA-256 hash chain makes later changes to the log detectable. Recordings can be deleted in the app at any time; exported files, study-folder copies and backups must be covered by the study team’s own deletion procedure.
Classification. The app is a research tool, not a medical device, and is not intended for diagnosis or treatment.
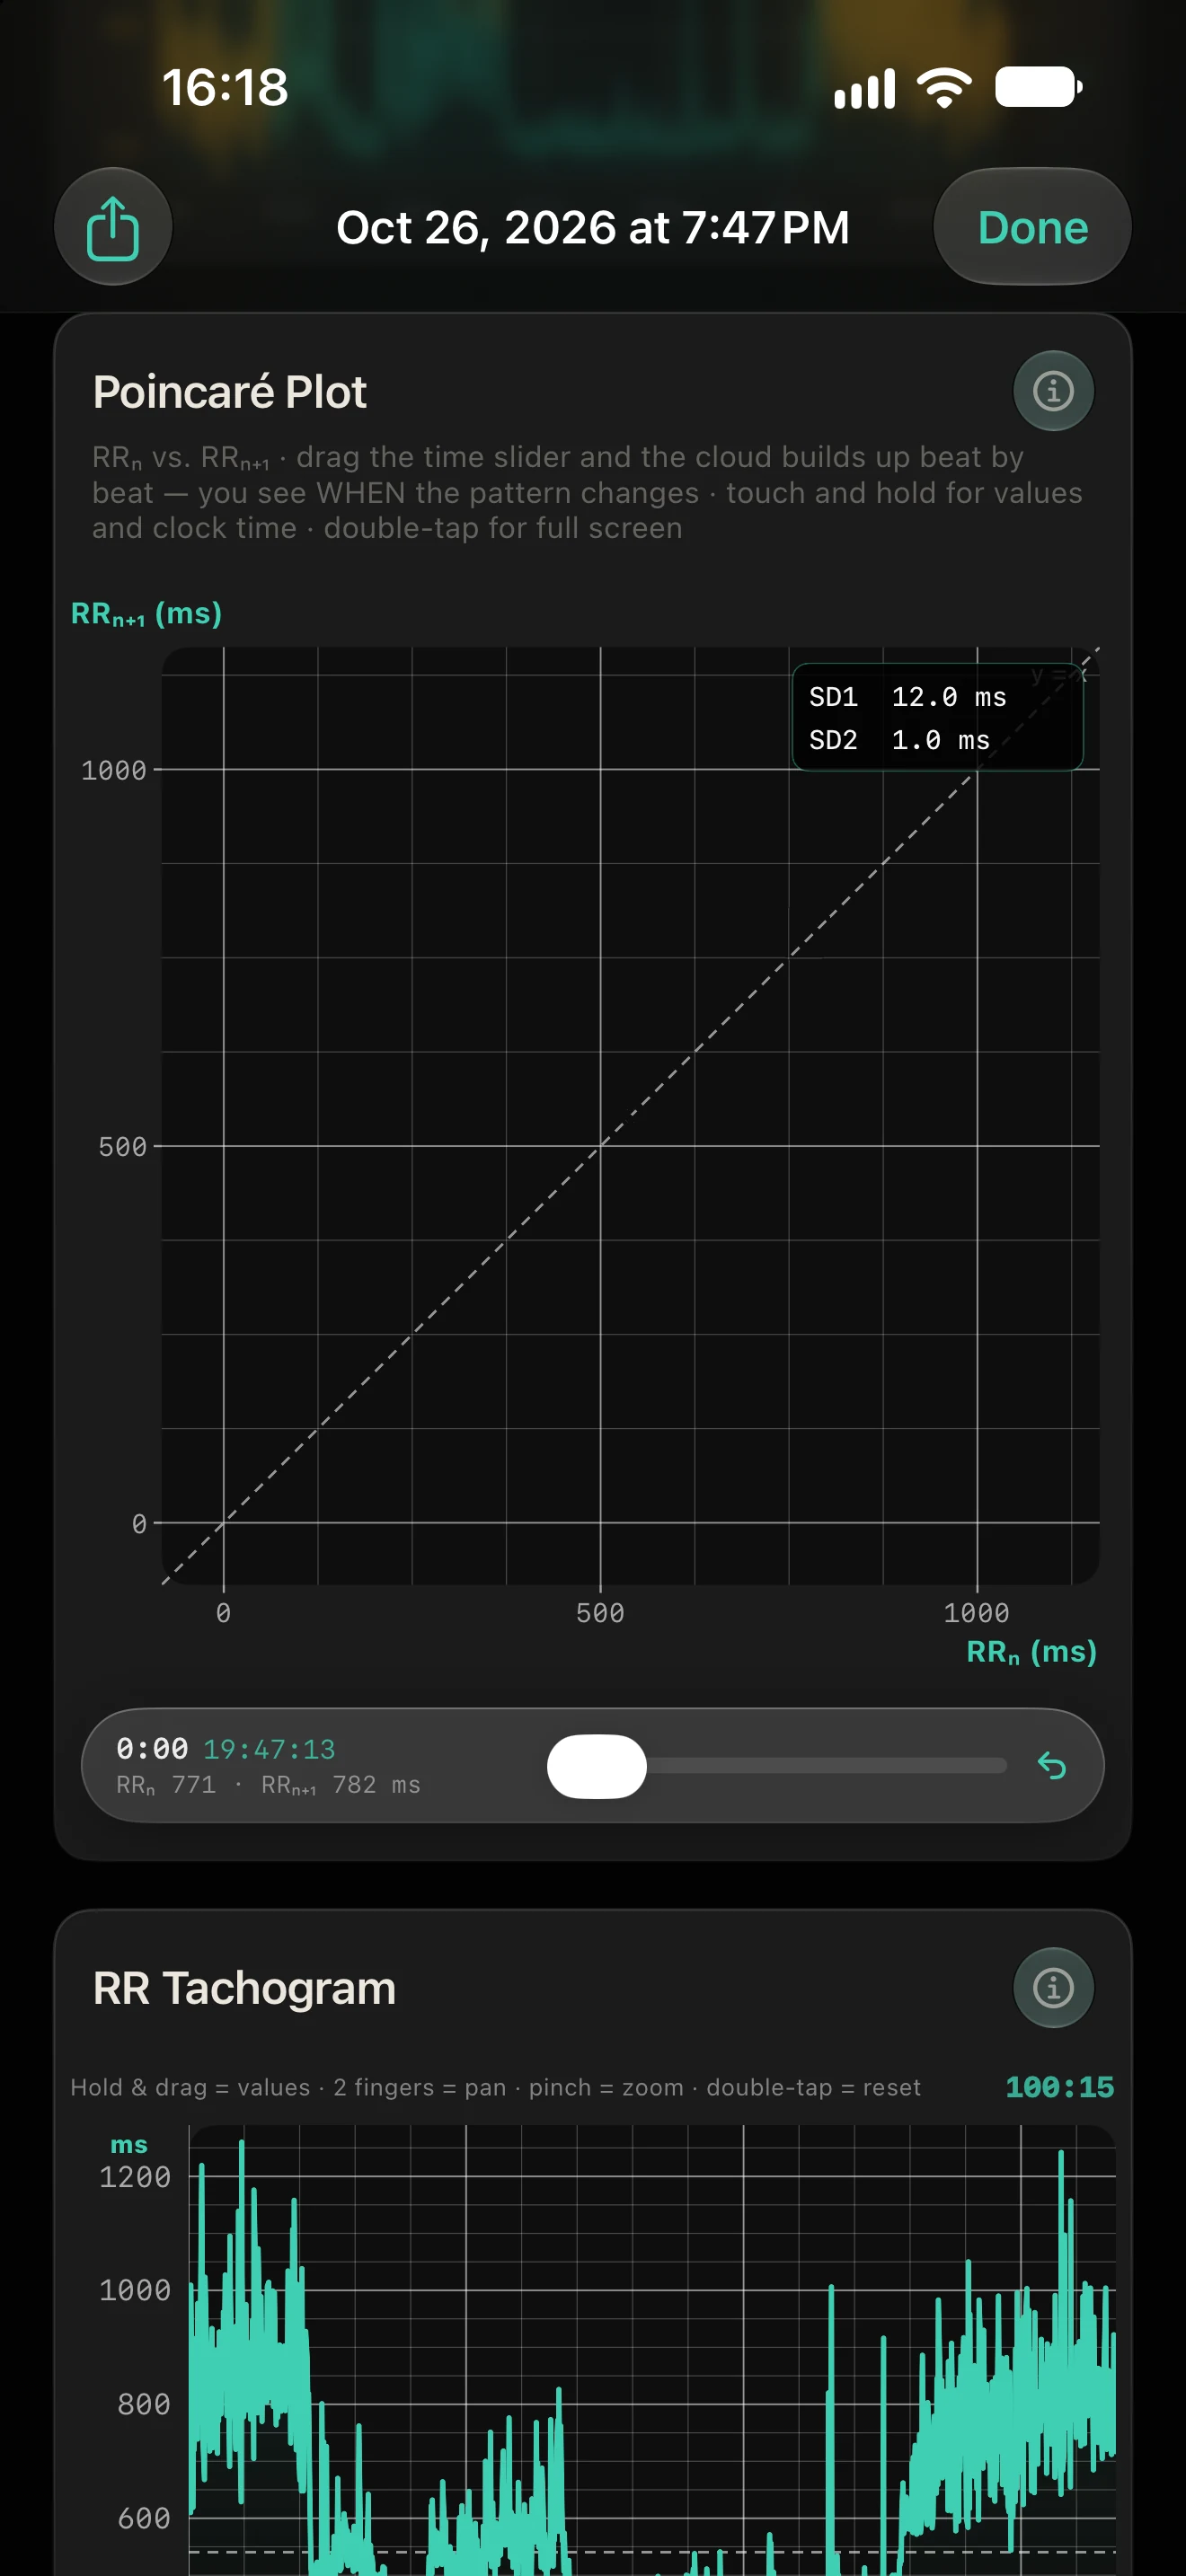
A 100-minute recording – rest, training, recovery – from one Polar H10. The time slider builds the Poincaré cloud over time; touch and hold to inspect any RR pair with its clock time.
Drag the time slider – the cloud builds up beat by beat. Then touch and hold the cloud: the crosshair shows each RR pair with its clock time.
The app's Poincaré card with a real recording: Polar H10 onboard memory, 100 minutes, 11,131 RR intervals. Background = app screen; the points and SD values are drawn from the app's own RR pairs.

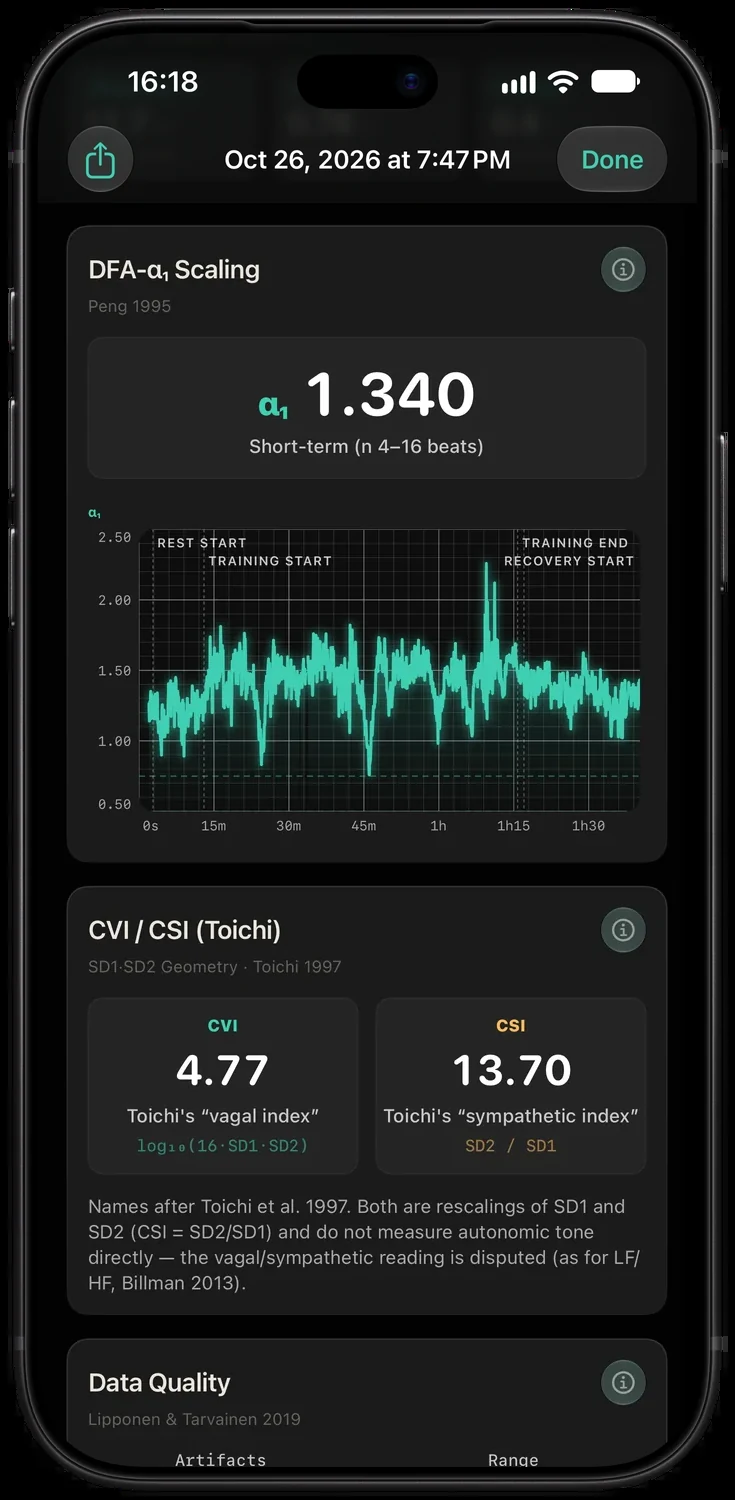
The measure exercise science uses to follow intensity – computed in 2-minute windows every 5 seconds, as in the exercise studies that established it (Rogers et al. 2021). Windows with 5 % or more corrected beats are marked invalid, never silently dropped, and every window is a row in your CSV.
Each metric is recomputed by an independent reference with the same definition and parameters. The dossier names every check and every tolerance. This covers computation and data handling – not a clinical validation of the sensors.
checks passed against NeuroKit2, SciPy and Task Force definitions
series with artifact detection identical to NeuroKit2 under matching settings, beat by beat
beats in synthetic test vectors and real Polar H10 / Movesense recordings
The app keeps the RR data as the sensor recorded them. Every metric is computed fresh from those originals, so methods can improve without your data being altered.
RR intervals are kept as recorded – never smoothed or overwritten; corrections are stored separately, impossible values are discarded and counted.
An improved method applies to every recording you have ever made – open or re-export it to get the latest analysis.
Exports with a header name the app version; the complete export and the report also document the exact method. Anyone can recompute the values with open tools – for peer review, replication or new methods.
Several participants per session, phases marked live, DFA α1 over time for intensity research.
Every new recording copied to a study folder you choose in the Files app – iCloud Drive or your institute's cloud – for multi-site studies. Volume purchasing through Apple School or Business Manager is planned for launch.
A methods text to adapt, figures in journal widths, and data your supervisor can recompute.
No account, no CARLON server, pseudonymous IDs and an append-only audit trail – material for your ethics application.
Heart rate and HRV live during the session with your client – and a PDF report to hand over afterwards.
Small groups of up to four participants per session from one iPhone, each recording matched to its participant code with its stored start time.
CARLON HRV Research records, organizes and documents; Kubios HRV remains a reference for analysis. The CSV carries the intended settings for the Kubios custom text import, with TXT and FIT as further RR paths – a documented import test is in progress. Comparable metrics need matching analysis settings; the app's own metrics are there as a cross-check.
Testers told us where the work piles up in their studies. We built the answer with them – and now it saves the next studies these steps.
Before: every recording marked by hand – or phase times on paper, aligned afterwards.
→ Now: group phase markers – one tap marks the phase in every running recording.
1 tap instead of 4Before: export the RR data, then cut rest, training and recovery by hand in a spreadsheet – per participant.
→ Now: the segment table – heart rate, RMSSD, SDNN and pNN50 for every section between two markers, ready for the results table.
no spreadsheet stepBefore: read phase times off the clock for the paper case report form, then convert them into Kubios sample offsets by hand.
→ Now: the event and segment tables – every marker with clock time and seconds from start, every section between two markers with start, end and duration. The timing section of the form and the Kubios sections can be taken from the export.
no clock arithmeticBefore: convert the export before the institute’s tools can read it.
→ Now: EDF+ with the phase markers inside, plus FIT and WFDB for PhysioNet-compatible tools – straight from the iPhone.
no converterTwo sensors, both tested with the app: the Polar H10 chest strap – live and in its internal memory – and the Movesense Flash sensor – live and recording in the sensor itself, where the app also saves raw ECG and 9-axis motion (accelerometer, gyroscope, magnetometer) as CSV. Both can run side by side in one study.
Polar H10: up to 95,000 RR intervals in the sensor – about 20 hours of everyday life, about 10.5 hours at 150 bpm; one recording per strap. Movesense Flash: about 11 hours of ECG at 256 Hz plus motion in its 128 MB memory. The iPhone needs to be nearby only to start, and to stop and read out.
Yes – up to four from one iPhone. They record to their own memory and are read out together afterwards; each recording is assigned to its participant code with its stored start time.
The CSV carries the intended settings for the Kubios custom text import in its header; the app also writes a Kubios text file and FIT. RR intervals are exported as recorded. Comparable results also depend on the analysis settings you choose; a documented Kubios import test is in progress.
Tap an event button at each phase change. The segment table lists duration, beats, heart rate, RMSSD, SDNN and pNN50 for every phase between two events, computed with the same validated code as the rest of the app.
Every metric is compared with independent reference implementations (NeuroKit2, SciPy, Task Force definitions) on 18 RR series with 20,431 beats: 331 of 331 checks passed (metric comparisons plus artifact, threshold and rhythm checks). With matching settings, artifact detection matches NeuroKit2 beat by beat. The version-specific dossier lists every check with its tolerance. This verifies the computation, not the clinical accuracy of the sensors.
Yes. The app keeps the original sensor data and computes every metric fresh from it, so an improved method applies to all past recordings. Open or re-export a recording to get the latest analysis; files you exported earlier stay unchanged and name the app version that produced them. Archive the files used for your study.
Yes. The RR exports contain the original intervals; the complete JSON export and the report add each beat's artifact flag and correction, the app version and the exact method of every metric. With open tools such as NeuroKit2 or SciPy, anyone can recompute the values – the validation dossier shows how.
The app processes data on the iPhone and sends no measurement data to us. Copies exist only where you create them: an export, a study folder you choose, or your iPhone’s own backup. There is no account and no CARLON server.
No – CARLON HRV Research runs on iPhone with iOS 17 or later. The exported files can be processed on other platforms with compatible software.
No. It is a research and wellness tool and is not intended to diagnose or treat any condition.
Yes – it is built for that: participants under a study code, phase markers, values per phase, a draft methods paragraph, figures at 300 dpi and a citation with the app version. The data stay on the iPhone until you export them or switch on the study folder; check your university’s rules on where study data may be stored.
During the beta, access is by invitation through Apple TestFlight. At launch it is planned as a one-time purchase on the App Store – no subscription, no per-participant fees; volume purchasing for institutions through Apple School Manager or Apple Business Manager is planned.
We are opening the beta to labs, researchers and coaches who work with real data. Tell us where you work and which sensors you use – we’ll get back to you about TestFlight access. Your field feedback shapes the next build.
Prefer email? jan@vitalkultur.com
Page updated Nov 2, 2026 · app 1.4 (build 2026102801) · validation dossier 1.4
For research and wellness use. Not a medical device. Polar H10, Movesense and Kubios are trademarks of their respective owners; CARLON HRV Research is an independent app and not affiliated with them.